Experimental Paradigms
Elijah Galvan
September 1, 2023
10 min read
In this section, we will look at standard social decision-making paradigms. We will be referring to the standard 1-shot paradigms: multiple interactions nearly always ought to be modelled using learning models.
These tasks are often amended to answer specific research questions. Thus, if we know the standard game design we can think about how to change it to answer our research questions.
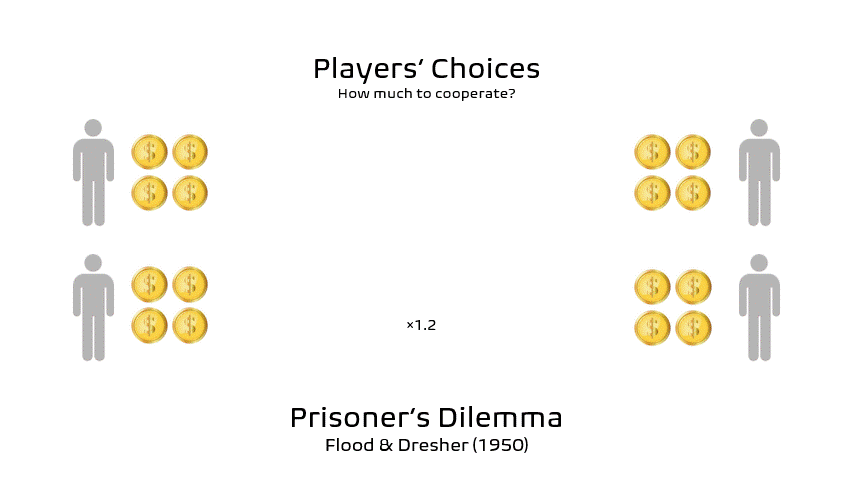
Prisoner’s Dilemma
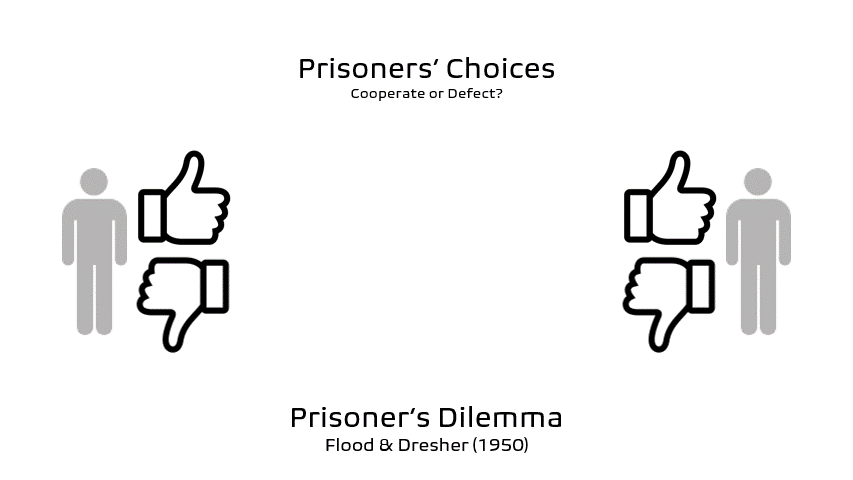
Both Players make a simaltaneous decision about whether to cooperate or defect. If both players cooperate, they usually receive a nice payout. If one player cooperates and the other defects, the defector receives a much larger payout than the cooperator. However, if both players defect, they both get nothing.
None
Cooperate-Cooperate Outcome
Cooperate-Defect Outcome
Defect-Cooperate Outcome
Defect-Defect Outcome
Cooperation Decision
37% of the time people cooperate (Mengel, 2017)
What causes defection is debated - risk and temptation are difficult to disentangle in this situation
Almost unusable for our purposes due to the fact that it is a risky choice and not many variables can be manipulated - often used in an iterated design to study strategic decision-making
Asymetric Costs/Benefits
Sequential Decision-Making
Public Goods Game
All Players receive an Endowment (money given by the experimenter to use in the game) and make a simaltaneous decision about how much to contribute to a community pot. The community pot is multiplied and equally distributed among all players, regardless of contribution. Payouts are the sum of money not contributed to the community pot and money received from the community pot.
None
Community Pot Multiplier
Endowment Amounts
Contribution Amount (Individual)
Total Wealth (Group)
Most people give at least something, average giving behavior is 37.7% of the Endowment (Zelmer, 2003)
Considered to measure cooperation
To use in utility modeling, it may require this game be played sequentially to make this a non-risky choice - more often used in repeated interactions to study group-level dynamics (i.e. Total Wealth accumulated over a certain number of trials)
Asymetric Costs/Benefits
Asymetric Endowments
Earned Endowments
Minimum Combined Contributions
Sequential Decision-Making
Ultimatum Game
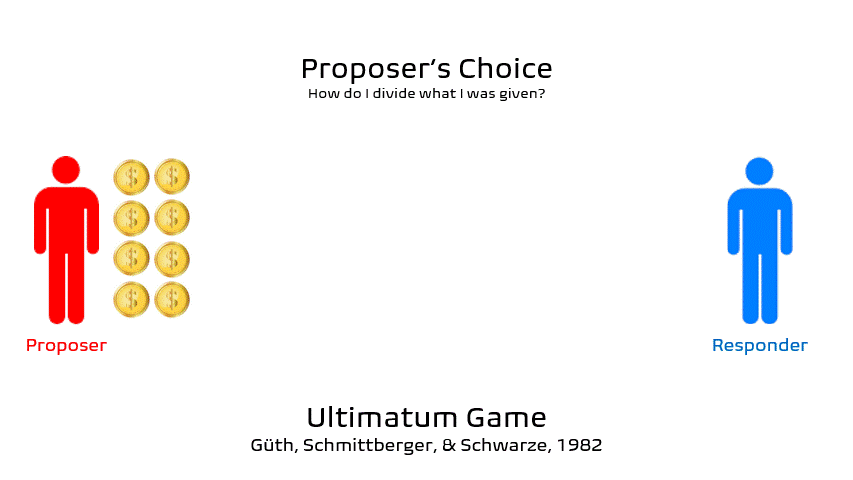
The Proposer receives an Endowment and makes an Ultimatum Offer to the Responder. The Responder decides to accept the Ultimatum Offer - in which case both players receive the division according to the Ultimatum - or reject it - in which case both players receive nothing.
Proposer
None
Endowment Amount
Offer Amount
Responder
Offer Amount
Endowment Amount
Ultimatum Response
Most proposers offer around 40% of the Endowment (Camerer, 2011)
Ultimatums reflect first order-beliefs and thus, Proposing Behavior consider to measure Strategic Bargaining
99% of people accept Ultimatums of 50% of the Endowment, 90% of people accept Ultimatums of 40% of the Endowment
65% of people accept Ultimatums of 30% of the Endowment
50% of people accept Ultimatums of 20% of the Endowment
70% of people accept Ultimatums 10% of Endomment
Responses measure tolerance of unfairness
Offer Game
Demand Game
Three-Player Ultimatum Game
Proposer’s Endowment
Earned Endowment
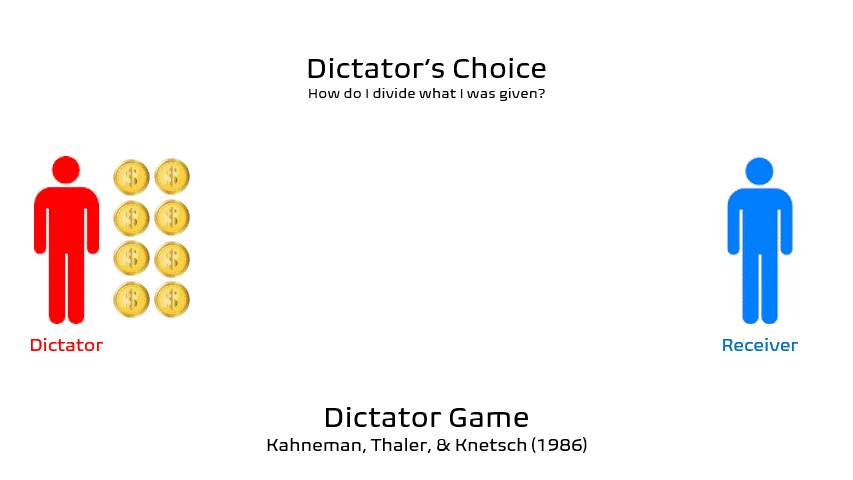
Dictator Game
None
Endowment Amount
Given Amount
Most Dictators offer around 20-30% of the Endowment (Camerer, 2011)
Given Amount is taken as measure of fairness or altruism
Impunity Game
Taking Game
Three-Player Dictator Game
Earned Roles
Earned Endowment
Trust Game

The Investor is given an Endowment. They must then decide how much to invest and how much to keep for themselves. Any money kept is guaranteed payout. Any money invested is multiplied and given to the Trustee who must then decide how much to keep and how much to return.
Investor
None
Endowment Amount
Investment Multiplier
Invested Amount
Trustee
Investment Amount
Endowment Amount
Investment Multiplier
Returned Amount
Average Investment Amount is 51.7% of the Endowment (Houser, Schunk, & Winter, 2006)
Investment Amount is considered a measure of Incentivized Trust- i.e. risk perception and preferences - but is also confounded with prosocial preferences
Average Returned Amount is approximatley 40% of the Multiplied Investment and is generally consistent irrespective of the multiplier (van Baar et al., 2020)
Returned Amount is considered to be a measure of Positive Reciprocity
Most people believe that the Investor expects them return 50% of the Mutliplied Investment (van Baar, Chang, & Sanfey, 2019)
Dishonest Salesman Game
Trading Game
Lending Game
Earned Endowments
Gain/Loss Outcomes
Hidden Multiplier Trust Game
Justice Game
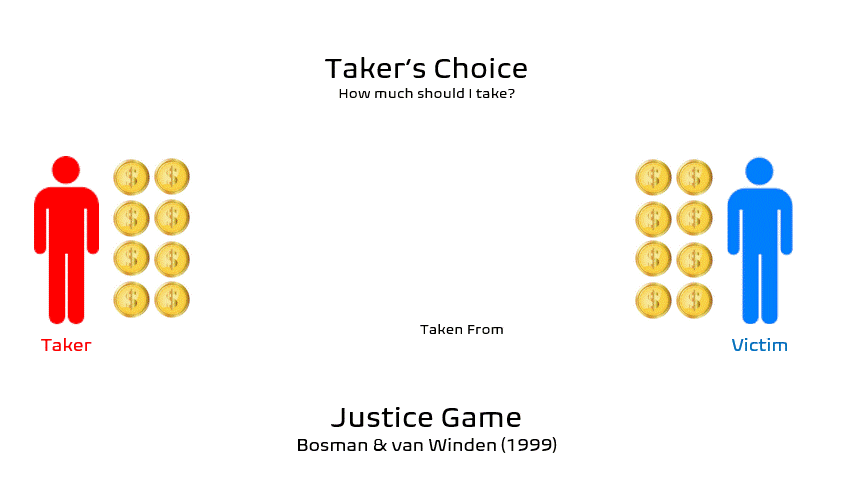
Both Players are given an Endowment and the Taker is allowed to take a certain amount of the Victim’s Endowment - usually a maximum of 50% of the Endowment. Then, the Victim is allowed to spend a certain amount of money to destroy the Taker’s money. The money destroyed is usually 3 times what the Victim spent.
Taker
None
Endowment Amounts
Maximum Taking Amount
Maximum Destroying Amount
Punishment Multiplier
Taken Amount
Victim
Taken Amount
Endowment Amounts
Maximum Taking Amount
Maximum Destroying Amount
Punishment Multiplier
Punishment Amount
Average Taken Amount is 58.5% of the Victim’s Endowment (Bosman & Winden, 2000)
Taken Amount is considered to measure risk tolerance and one’s willingness to be unfair
Average expected destruction rate is 24% of the Taker’s Endowment (Bosman & Winden, 2002)
Average Amount spent on Punishment is 15.6% of the Taken Amount (Bosman & Winden, 2002)
Punishment Amount is considered to measure tolerance for unfairness
Three-Player Justice Game
Three-Player Compensation Game
Earned Endowments
Asymetric Endowments
Earned Roles